CHAPTER ONE: Introduction
The research aims to analyse the Indian education system as a way to understand why there is vast gender inequality there. Looking at the country’s gender statistics gives a good overall indication of what has been happening in India since the Millennium Development Goals were set, and how close they are to achieving various gender specific goals set by the United Nations and the Government of India. Women are crucial to a country’s development and the economic survival of their own personal households (Khalid, 2008). Very little recognition is given to the role they play in development, especially as in the developing world the majority are employed in the informal sector. Education remains the most important tool for enhancing women’s socio economic situation and statistically has been associated with better health, lower fertility rate, higher economic growth and better standards of living (Khan, 1993, Khalid, 2008). Especially in India, institutional, social, psychological and cultural boundaries limit a female’s potential (Jain, 2003, Khalid, 2008). As UNICEF (2014) found, many demand-side barriers still arise from sociocultural norms and so can be extremely difficult to change.
Gender inequality in India is largely the result of the deeply ingrained systems of patriarchy. Jain (2003) found that discrimination against women begins before birth, and called this systemic subordination. Usha Choudhury’s experience illustrates the cultural pressures faced by girls of school-age, she became an advocate for girls in Rajasthan (Girls Not Brides, 2015). When she was 14, her parents wanted her to get married and drop out of school. Usha knew that early marriage meant violence and depravation, and saw education as her only way out. She worked multiple jobs to pay her school fees and after she graduated, opened Vikalp Sansthan, an organisation helping to improve the lives of girls in Rajasthan. She felt that the main barrier to girls achieving their dreams was the attitudes of parents towards their daughters, saying “Why bother with her education? …They are not allowed to have dreams.” (Girls Not Brides, 2015). Usha’s ending is a happy one, but the majority of girls will never feel that empowerment and freedom that education can give them. This is a prime example of why education for women is so important, and has a multiplier effect.
In India, the educational system is broken down into three levels in total and five sub-levels: elementary, which includes primary (I-V) and upper primary (VI-VIII); secondary, which includes secondary (IX-X) and higher/upper secondary (XI-XII); and higher education (UNICEF, 2014). However, little research has been done in India relating to the transition rates for females at further levels of education, i.e. secondary school onward. This study intends to examine to what extent the rate is lower for some females and why there is a large gender gap in specifically higher education. This will involve looking at a number of contributing indicators and factors into a girl’s education, which will be discussed in the next section. Many frameworks and policy suggestions for developing countries have been written and this research will also be using these to see how India will be able to improve its gender equality for females in education. For the purposes of this study, further education refers to upper secondary school and colleges, and higher/tertiary education refers to university and equivalent organisations.
In the Indian constitution, the principle of gender equality is a basic right of women. The constitution also “empowers the state to adopt measures of positive discrimination in favour of women” (Ministry of Women and Child Development, 2001). The state has also passed several social and labour legislations and created special programmes and schemes for the well being and development of women and children. Women also have reserved places in many educational and training institutions, development schemes, local bodies and certain categories of government jobs. The Parliament set up the National Commission for Women in 1990 to safeguard women’s rights and legal entitlements. India has also ratified the Convention on Elimination of All Forms of Discrimination Against Women (CEDAW) in 1993, and has signed multiple strategies and plans of actions e.g. Mexico Plan of Action (1975), Nairobi Forward Looking Strategies (1985). The Indian situation is extremely difficult as there is a large disparity between the numbers on paper and the conditions on the ground (Jain, 2003). India seems to still have a large gap between the goals in the various methods of action and the situational reality of women. The worst hit women of this gender inequality are minority women, including those from the Scheduled Castes, Scheduled Tribes and Other Backward Classes.
Scheduled Castes are defined as the ‘untouchables’ in orthodox Hindu scriptures, and are considered the lowest caste. The Scheduled Tribes are referred to as an indigenous people who are officially regarded as being socially disadvantaged. Other Backward Classes are considered to be castes which are socially and educationally disadvantaged. The Government of India has several official classifications of caste and it is a system of social stratification. There have also been multiple policies and interventions regarding education, including the Sarva Shiksha Abhiyan (SSA) (Education for All), the National Literacy Mission (NLM), the Right of Children to Free and Compulsory Education Act, the Rastriya Madhyamik Shiksha Abhiyan (RMSA) (National Secondary Education Mission) and the Rastriya Uchha Shiksha Abhiyan (RUSA) (National Higher Education Mission). Some of these will be discussed and evaluated in later chapters.
This research aims to examine female education in India, why there may be such large gender gaps, and what may work to improve this. Therefore the research question is proposed below.
To what extent is there a gender gap in the Indian education system, and, if so, what can be done to narrow it?
Aim 1. To explore to what extent there are gender inequalities in education.
Objective 1.1. Research transition rates for girls in the education system, the gross enrolment ratio, literacy rates from various sources, and statistical data on early marriage rates. These are found by employing quantitative methods including official statistics and government documents.
Aim 2. To explain, if there are any, the gender inequalities in education and what these could be caused by.
Objective 2.1. Investigate the government policy in the area of female education, grassroots organisations for the improvement of girls’ education, and government documents and policies for the improvement of girls’ education using quantitative methods of evaluation including academic research, NGO studies and governmental studies. This will involve drawing conclusions on how successful these policies and interventions have been.
This dissertation has used much research from many different sources. The main theoretical contribution would be the harmonising between feminist theory and human capital theory. Both are extremely important in the field of not only gender studies but also education studies. However, not much has been written which incorporates both, even though they are almost complementary. There is also a contribution of the use of multiple indicators, this is so that when analysing the data the researcher has a much more comprehensive perspective to be able to recommend effective remedies.
The methodological contribution of this dissertation is the use of many different indicators. Various measures of gender equality and education in UN organisations, NGOs and government institutions tend to use a base set of unreliable measures like the GER, GPI etcetera. However there is no way that these can give a good indication of the situation (UNICEF, 2014). It is massively important to look at multiple aspects and sources of data to get a good overall perspective to give the best policy recommendations. This means it is also important to not just use quantitative exploratory methods as these do not show the full picture, it is crucial to look at qualitative explanatory methods.
This dissertation has focused more upon what results various policies and interventions have produced, and also qualitative results. When governments implement new policy it is invaluable to use real stories, real people and not just data and numbers. There are so many issues when using just quantitative data to come to a conclusion, especially around an important topic like gender equality and education. By building on various studies, theories and statistics, this study could provide an overall insight to help policy makers, higher education planners and researchers to restructure existing measurements, systems, policies and institutions.
CHAPTER TWO: Literature Review
This chapter will examine some of the existing research surrounding gender inequality in India. It is important to note the effect that a large population going into higher education can have on a countries economic and social development (Tilak and Biswal, 2015). According to Tilak and Biswal (2015) tertiary education is a key to individual property, economic security and strengthening democracy. In India, the central government has implemented many progressive changes and has a target of 30% gross enrolment ratio in tertiary education by 2020, and the Indian education system is now one of the largest in the world.
Early attempts to incorporate women in development was Women In Development (WID) which identified women’s lack of access to resources as a key to their subordination, however they did not question or challenge the social relations of gender and it was based on the assumption that gender relations would change once women became full partners in development (Rathgeber 1990, Kabeer 1994, Razaui and Miller 1995, as cited in Jain 2003). The Gender And Development (GAD) approach emerged as an alternative to WID and went further by assessing the underlying assumptions of current social, economic and political structures and strategies, and called for a fundamental re-examination of social structures and institutions which promote and sustain gender based inequalities (Young 1993, Kabeer 1999, as cited in Jain 2003). Boserup (as cited in Willis 2011) argued that as societies modernised from a rural core to an urban base women were increasingly excluded as they were associated with just the domestic and reproductive sphere (Willis, 2011, p. 142).
2.1 Gender inequality in education
In nearly every country there is a certain amount of gender inequality in education, in some countries girls outperform boys, in others they are not allowed to go to school (Parsons, 2009). In the developed world, girls are more likely than boys to go onto university (Parsons, 2009) but in the developing world many girls will not be able to reach secondary school (Marshall, 2014). There can be many different forms of gender inequality, especially in the developing world. In the Global South, girls face barriers in accessing education, often as a result of deep-rooted social and cultural practices, such as preference for a son’s education, violence against girls’ inside the home and in educational institutions, and household duties and domestic obligations (Marshall, 2014). In India specifically, all of the above mentioned barriers exist, as well as a number of smaller scale issues that arise, such as lack of girls’ toilets or lack of female teachers. The variety of obstacles that girls’ face in accessing even the lower levels of education mean that a multi-disciplinary, inclusive approach is needed to improve the situation in India. There are many definitions of the gender gap depending on what the nature of the research is focused on. For this study, the definition of gender gap is the difference in numbers of males and females, for example in education it would be the difference between how many females and males had enrolled in a certain year of schooling or the difference in the academic achievement of girls and boys. This research will focus on the gender gap in secondary and higher education institutions in India.
In human capital theory, education is an investment in the self, so if men earn more from their careers for the same level of education then the human capital model would predict a lower investment in female’s education (Khan, 1993). As Jain (2003) said, the inclusion of girls in as many diverse fields as are available in society must be reinforced and the need for necessary investments in their education must be recognised. If this happened, it would change the overall situation in women’s employment and consequently motivate parents and communities to support female education. Improving girls education would help to eliminate the gender gap in employment and earnings and would have important non-market benefits like improved child nutrition and lower fertility (Strauss and Thomas, 1995, Khalid, 2008). Vella (1993) suggested that attitude towards female work are those which determine investment in human capital. Vella’s (1993) study shows that the attitudes of women towards women’s work are developed in youth and can lead to substantial reductions in human capital investment, labour supply and returns to education (Khalid, 2008, pp. 13-14). At a macro level, labour market discrimination needs to be reduced if there is going to be investments in girls education, as this makes it more economically attractive (Summers, 1994). However, it can be argued that human capital theory is too economics centric, and does not account or suggest solutions for vulnerable groups like minority women or disabled women.
Summers (1994) found that depravation is a vicious cycle, parents do not invest in their daughters because they don’t expect them to be able to make an economic contribution for the family, and so the prophecy becomes self-fulfilling (Summers, 1994). Khan (1993) wrote that families find the direct and opportunity costs of schooling difficult, as girls help care for siblings and do household and farm work. The direct cost of educating girls may be greater than that of educating boys as boys can contribute to their own support while in studies. This is linked to the labour market, in which females may earn less than their male counterparts and thus prevents them from becoming self-sufficient. It has been proven multiple times that educating women yields a higher rate of return than any other investment in the developing world (Summers, 1994, pg. 7). When girls have been educated, they have economic opportunities, their families have more of a stake in their survival and success, they marry later and are able to take part in household decisions, and they choose to have fewer children and thus can invest more in the health and development of each child (Summers, 1994). This shows that one females education can impact the next generation of both sexes and probably even further.
Supply-side expansion and falling poverty rates have led to an increase in the demand for higher education across India (Tilak and Biswal, 2015, p. 4). However, as Tilak and Biswal (2015) pointed out, a low level of internal efficiency and quality of learning holds the whole system back. Communication and collaboration between ministries in regard to policy and implementation remains an ongoing challenge, and policy has previously been focused just on expanding access and infrastructure, rather than processes that improve the quality of education (UNICEF, 2014). According to Unterhalter et al. (2014), improved female education can contribute to gender equality as a whole through the emergence of a new generation of educated females who are able to participate in political, social, cultural, economic and technological spheres, changed gender norms, attitudes and identities in both sexes, and changed gender relations in a variety of institutions at all levels.
2.2 Indicators used for this study
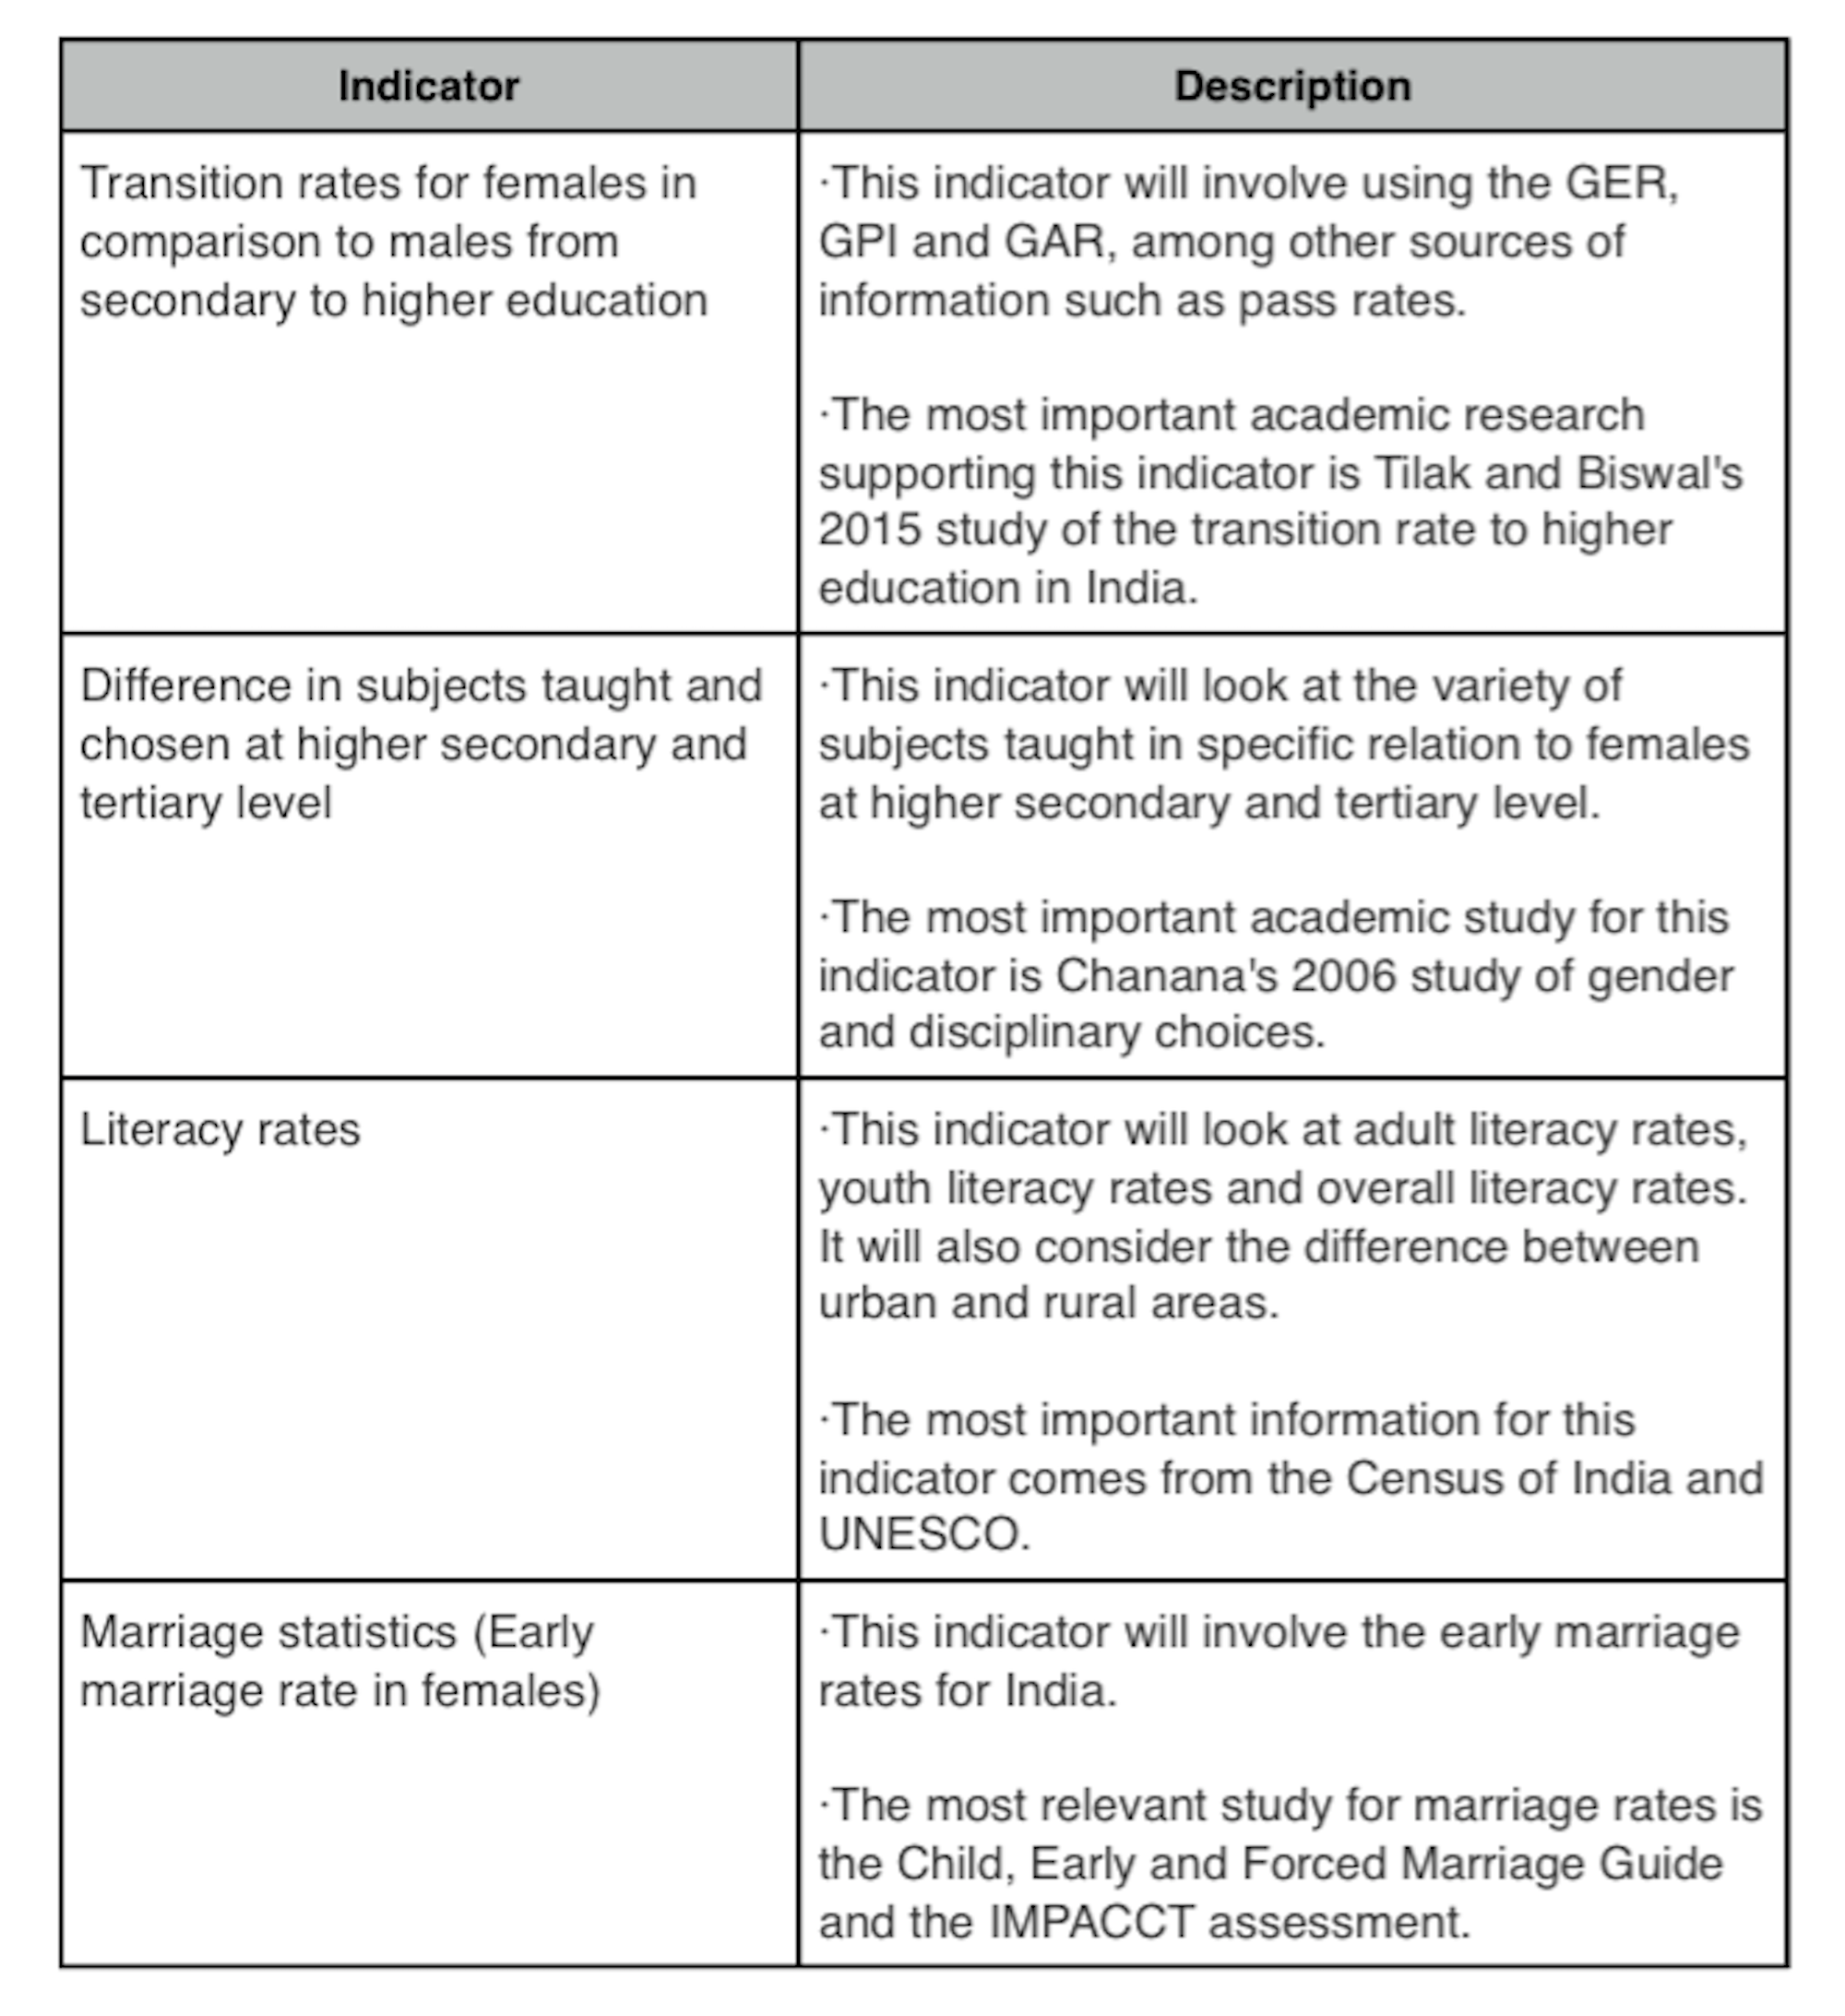
This study will involve looking at a number of indicators that have already been discussed by numerous organisations such as UNESCO, UNDP and the MDGs. For the purpose of this research, this research will be looking specifically at the transition rate from secondary education to higher education for females in comparison to males. Socioeconomic and political theories about gender gap can have a variety of bases ranging from disciplines like economics, to development studies, to geography, to politics. Previous studies have used too few indicators, which can be very narrow; therefore it is important to consider a variety of approaches to the gender gap to give a multidisciplinary approach to reducing it.
2.2.1 Transition rates
UNESCO used multiple indicators including gender parity in enrolment; adult illiterates; gross enrolment ratio in Primary, Secondary and Tertiary education; Primary to Secondary transition rate; government expenditure on education; and the percentage of female students in Primary, Secondary and Higher education. From UNESCO the most useful indicators for this research are gross enrolment rates, gender parity indices and percentage of female students at various levels of education. However, the enrolment rate only shows those who intend to study, it does not show those who attend regularly. Therefore, from this the first indicator, the transition rate for females in comparison to males has been evolved, this indicator is important as it shows where the gaps are in education, i.e. where girls are falling behind, and also the gross attendance rate. The Millennium Development Goal Number 3 looks at gender equality and used gender parity index of gross enrolment ratio, therefore the gender parity index will be used in this research. The World Bank also looks at the gross school enrolment as well as the Gender Parity Index. This will give a broad overview of the situation in India for women in education. The GER, GPI, GAR and pass rates are all important as they influence transition rates (Tilak and Biswal, 2015, UNICEF, 2014). The transition rate is vital as it shows where females may be behind in education and at what level they start to falter. They can reflect what needs to be changed in further education admission processes and higher secondary institutions, and they are linked with social inclusion and equity.
2.2.2 Difference in subjects taught and chosen
The above mentioned institutions do not look at subjects taught and chosen at higher levels of education which can be a major contributor to the gender gap through stereotyping, therefore the academic research surrounding the difference in subjects taught has either been found through independent academic studies or government publications. It is an important indicator as it shows how many females will study “masculine” subjects and why this may be, so again it will give an idea as to why less women go on to study in higher education as they may not feel they have access to the full range of subjects (Chanana, 2006).
2.2.3 Literacy rates
The MDG 3 uses gender parity index of enrolment but also uses the youth literacy rate, so from the MDG 3 I will look specifically at literacy rates for females in comparison to males. Literacy rates are also important as again, they give a situational overview of education. The literacy rate of a population is essential to a country’s development, it gives an overall perspective of educational attainment within a country, and can be investigated in depth at different age levels. Literacy can have a huge impact on a person’s education and how far they are able to develop their education further (Jain, 2003). The Millennium Development Goals and most UN institutions concerned with education or gender tend to use literacy rates to see what situation a specific country or region is experiencing (United Nations Millennium Project, 2005).
None of the above mentioned organisations look at marriage rates as a possible factor contributing to the gender gap in education so this research will be using early marriage rates to examine social indicators, this again is important as it is a barrier to many girls’ education. This factor could indicate why over half of the female population do not go into tertiary education. Early marriage rates have a massive impact on female education. This will be examined in more depth later on, but it is very important to look at marriage as it can directly end a girl’s education (Glinski, Sexton and Meyers, 2015).
From what has already been discussed, the study focuses on four indicators which will be the conceptual framework in this study as follows:
CHAPTER THREE: Research Methodology
3.1 Feminist Perspectives on Education
The most important goal for feminist theory is to explain female subordination (Tucker, 2011). Research conducted by feminists therefore aims to change women’s situation, thus research is for women, not just about women (Letherby, 2003). Feminist academia has an “overly political nature” (Letherby, 2003), and states that the ideal approach to research is respectful of respondents and acknowledges the subjective involvement of the researcher (Letherby, 2003). The subordination of women has been accepted because women themselves have accepted it and internalised its legitimacy, women see it as their natural destiny (Jain, 2003). Liberal feminists want equal access to education for both sexes, radical feminists believe there should be female-centred education for girls and Marxist feminists want to consider gender inequalities combined with inequalities of class and ethnicity (Parsons, 2009). They also believe that in all known societies’ tasks performed by women carry less status. Naussbaum (2000) said that women are often treated as ‘instruments’ of the ends of others as reproducers, caregivers, sexual outlets, and agents of family prosperity. Jayaweera (1997) found that in Asia, education is seen as having little or no value for the future role of girls as wives and mothers, so investment in girls’ education is often seen as a wasted resource. Feminist theory in regard to education looks at why females are unequal in the schooling system, and state that there is a hidden curriculum, where standards of proper behaviour for a society or culture are taught within the school system (eNotes, 2016). This then subtly reinforces behaviour and attitudes deemed appropriate. Girls are generally more supported in “feminine” subject areas such as home economics or the arts and boys are generally more supported in “masculine” subject areas like science and engineering (eNotes, 2016).
As quoted from Chanana (2006)- “family and educational institutions are sites of social reproduction, which communicate the binary opposition of femininity and masculinity and its evaluative components of ‘inferior’ and ‘superior’ respectively to infants, girls and boys who grow up interiorizing this difference” (Chanana, 2006, p. 269).
Feminist theory also discusses the teacher expectancy effect, whereby teachers often have different expectations for girls and boys. A teacher’s expectations of a student’s performance may affect the actual performance of a student (creating a self-fulfilling prophecy) through subtle cues from a teacher about how well they should be performing or what areas they should be interested in (eNotes, 2016). Previous researchers of gender and education believe that the increased participation of girls in education would eliminate the gender gap and inequality if underachievement and under-representation were taken care of (Chanana, 2006). However this has proven to be false as there are sometimes more girls than boys in lower levels of education and yet there is still a huge gap in secondary and further education.
The gender gap in India is situated within the deeply ingrained system of patriarchy and begins against women before birth. As mentioned earlier, Jain (2003) called this systematic subordination which can be extremely difficult to know what needs to change in the secondary and higher education system to improve gender inequality. Gender equality and equity both need to be seen as something which crosses not only educational systems but society as a whole. Jain (2003) stated that the problem of gender gaps and gender bias needs multiple level interventions that include proper policy and implementation. Inequality in education is often the result of societal and cultural values and systems (UNESCO and Adhayan, 2007). As Tilak and Biswal state ‘it is not possible to address the issue of social equity in tertiary education as it is conditional on the level of equity achieved in the school education sector’.
This research will be looking at specific districts and states in India as the country is easily one of the most diverse in the world and each different state can have vastly different outcomes, attitudes and development levels. It will study the different levels of education and how much the female population is achieving in this field. This study has used various written text, statistics and research documents to fulfil the secondary data analysis. This research is based on assessments of the work published in various academic documents, dissertations, published books by the World Bank and from university libraries, and published works by large development organisations and multilateral agencies. The research has also used published documents by the Government of India and various Indian scholars. However, it could be said that this review is biased towards works circulating in a specific section of the academic community as much work of Southern academics is not distributed through these channels.
This study will use both quantitative and qualitative secondary research, thereby using mixed methods. This is because looking only at quantitative research may not fully show the situation on the ground, and may also be just an average for the whole country. Some areas are severely unequal for women whereas others are far closer to gender equality.
3.2.1 Secondary Quantitative Data
This research used official statistics as the main source of secondary quantitative data from various sources. These sources include the Government of India’s household census, the Ministry of Human Resource Development for educational statistics and UNESCO’s data bank for educational and general statistics. The issue with using official statistics as secondary data is that there is always a chance these statistics have been altered or presented in a way that gives a different perspective, for example, the gross enrolment ratio from the Government of India may be different to the gross enrolment ratio given by UNESCO. There have been limited attempts to study transition rates into further education in India, and the few that have been attempted have been based on household data collected in National Statistic Surveys, these studies also use different methods to estimate transition rates (Tilak and Biswal, 2015).
As UNICEF (2014, p. xi) states, small differences in definitions of statistics or calculations can lead to very different policy implications. This therefore means it is important to look at a variety of statistics, for example the major difference between Household Surveys and Administrative Surveys is that Household Surveys look at children in a particular age group, Administrative Surveys focus on children in a particular grade, therefore they should be considered together for analytical purposes (UNICEF, 2014). Administrative data from educational institutions does supply a regular source of data, but they only have limited coverage of informal and private schools (UNICEF, 2014). There is also an issue of state-level variations in school structures which means estimates for the country as a whole can sometimes be slightly inaccurate. However, official statistics are also more reliable in some ways, as they are an unobtrusive method (Lee, 2000).This means that when a person is filling out the census form they will not feel embarrassed or worried about what level of education they have or if they are illiterate, therefore official statistics lack reactivity.
3.2.2 Secondary Qualitative Data
The research has used secondary qualitative data to explore policies and schemes that have been implemented already and to see if these have been successful. The data will show what works in rural areas in comparison to urban areas. Rural areas are often the worst hit for gender equality and may need completely different attention to detail than urban areas may need, such as community based initiatives (Jain, 2003).
As mentioned before, the research will also be looking at qualitative research that has already been done in the forms of essays, policy documents and academic research. These mainly scrutinise case studies of improving gender equality in various forms of education, for example the Mahila Prasikshan Kendras and the effect these may have on girl’s education and gender equality in education. The majority of the qualitative research has been found either through academic libraries, United Nations websites, and various NGO websites.
4.1 Exploratory phase using quantitative methods
This chapter will be showing the quantitative findings of the exploratory phase and showing how these relate to female education and the gender gap. It will focus on the four indicators previously discussed and look specifically at data such as gross enrolment ratios, transition rates, literacy rates, marriage rates, and pass rates for different subjects at secondary and tertiary level.
Transition rates can show an important pattern relating to female education. If less girls are transitioning to further education, a solution to this needs to be found. The gross enrolment ratio (GER) is defined as the total student enrolment in a given level of education, regardless of age, expressed as a percentage of the eligible official age group population in a given school year, and can give an overall indication of the difference between males and females in certain levels of education. Below is the GER from 2013-14 for school and 2012-13 for higher education (for level wise enrolment in numbers, see Appendix 1).
Table 1. Gross Enrolment Ratio at different levels of education (2013-14 for school and 2012-13 for higher education).
| Level | Boys | Girls | Total |
| I-V Primary | 98.1 | 100.6 | 99.3 |
| VI-VIII Upper Primary | 84.9 | 90.3 | 87.4 |
| I-VIII Elementary | 93.3 | 96.9 | 95.0 |
| IX-X Secondary | 73.5 | 73.7 | 73.6 |
| I-X Primary to Secondary | 89.4 | 92.4 | 90.8 |
| XI-XII Upper Secondary | 49.1 | 49.1 | 49.1 |
| I-XII Primary to Upper Secondary | 83.3 | 85.9 | 84.6 |
| Higher Education | 22.3 | 19.8 | 21.1 |
Source: Government of India, Ministry of Human Resource Development, (2014). Educational Statistics at a glance. New Delhi, p. 7.
When looked at as a whole, the gross enrolment ratio for females looks promising. Especially for primary school, where there are more students than the eligible age attending. The GER for secondary school has also been increasing rapidly in just five years. However, the tertiary GER is harder to calculate as not only is there not as much information available but there are different sectors for higher education and little data has been provided before 2008. As mentioned before, India has a target of 30% GER in tertiary education by 2020. A study done by Bhaumik and Chakrabarty (2011) used the National Sample Survey of India from 2005, and used the following sample sizes of people aged 25 to 55: urban males – 31,709; urban females – 31,127; rural males – 58,027; and rural females – 58,834. Bhaumik and Chakrabarty (2011) found that the transition probabilities for males are higher than females for all education levels. Their findings indicated that an urban male has 13.06% probability of transitioning to tertiary education, with the rural male only having 5.04% probability (see Appendix 2 for full probabilities). The situation for females is even worse, an urban female has a 5.88% probability of transitioning to tertiary education, and a rural female has a less than 1% probability. However, what needs to be remembered is that this data is calculated on the 2005 NSS and so could be relatively outdated.
The transition rate definition can vary depending on how it is calculated. For example, Bhaumik and Chakrabarty’s (2011) method used employment and unemployment data as well as individual and household characteristics, the economic environment, and location. This differs to Tilak and Biswal’s (2015) method which used estimated transition rates to higher education through school education statistics. In Tilak and Biswal’s (2015) study, they found that limitations of data in India made it impossible to get accurate estimates of transition rates from higher secondary to the first cycle of higher education which includes undergraduate, post-school diploma and certificate programmes. Tilak and Biswal (2015) calculated the following transition rates from higher secondary to higher education:
Table 2. Transition Rates from higher secondary to further education, 2007-2010.
| Year | Transition Rate[1] | Eligible Transition Rate[2] |
| 2007-2008 | 60.0% | 60% |
| 2008-2009 | 58.1% | 62% |
| 2009-2010 | 63.9% | 63% |
Source: Tilak, J. and Biswal, K. (2015). The Transition to Higher Education in India. The Transition from Secondary Education to Higher Education Case Studies from Asia and the Pacific, p. 55.
The Eligible Transition rate tends to be higher as it excludes drop outs and failures in the higher secondary exams. Neither of the rates can be totally correct as many schools have a pre-final exam board before sitting the final exam and only those who pass this are allowed to sit the final exam. This therefore shows that only 60% of those who pass higher secondary go onto tertiary or further education. Bhaumik and Chakrabarty (2011) also looked at the distribution of educational attainment, which can be found at Appendix 3.
The pass rate for secondary and higher secondary is also important to examine, Appendix 4 and 5 have the full pass rates from 2005 to 2010. Table 3 looks at the pass rate for Class X between 2008 and 2010. For full pass rates, see Appendix 6 for Class X and Appendix 7 for Class XII.
Table 3. Class X pass rates from 2008 to 2010.
| Year | Boys | Girls | Total |
| 2008 | 65.0 | 70.5 | 67.4 |
| 2009 | 65.3 | 74.3 | 69.2 |
| 2010 | 72.6 | 76.6 | 74.3 |
Source: Government of India, Ministry of Human Resource Development, (2012). Results of High School and Higher Secondary Examinations 2010. New Delhi, p.X-42.
Table 4. Class XII pass rates from 2008 to 2010.
| Year | Boys | Girls | Total |
| 2008 | 68.4 | 79.5 | 73.0 |
| 2009 | 73.0 | 80.7 | 76.2 |
| 2010 | 72.7 | 80.8 | 76.2 |
Source: Government of India, Ministry of Human Resource Development, (2012). Results of High School and Higher Secondary Examinations 2010. New Delhi, p.XII-48.
In the National Sample Survey (2015), very interesting results were produced. More than 12% of rural households did not have any secondary schools within 5km (National Sample Survey, 2015). This survey looked at not only the GER but also the Gross Attendance Ratio and Age-Specific Attendance Ratio. These statistics give a very different outlook on the situation as they show the school attendance in totality.
Table 5. Gross Attendance Ratio at different levels of education in 2014.
| Rural | Urban | Total | |||||
| Male | Female | Male | Female | Male | Female | Both Sexes[3] | |
| Primary | 102 | 100 | 102 | 102 | 102 | 100 | 101 |
| Upper Primary | 91 | 88 | 93 | 88 | 92 | 88 | 90 |
| Elementary[4] | 97 | 94 | 98 | 95 | 97 | 94 | 95.5 |
| Secondary | 86 | 84 | 90 | 94 | 87 | 87 | 87 |
| Higher Secondary | 63 | 58 | 73 | 75 | 66 | 63 | 64.5 |
| Primary – Higher Secondary | 91 | 88 | 93 | 93 | 91 | 89 | 90 |
| Above Higher Secondary | 12 | 9 | 18 | 18 | 14 | 12 | 13 |
Source: Government of India, Ministry of Statistics and Programme Implementation, National Sample Survey Office, (2015). Key Indicators of Social Consumption in India Education. New Delhi, p. 12.
The Age-Specific Attendance Ratio gives an idea of the proportion of persons of a particular age group currently attending educational institutions, irrespective of the level or class in which they are studying (National Sample Survey, 2015). Table 6 shows the Age-Specific Attendance Ratio, showing that between the age groups of 6-13 years and 14-17 years, generally the gap between elementary and secondary education, the attendance ratio drops by 14%. From elementary to higher education it drops by 58%. This shows that the majority of students are dropping out between secondary and higher education. This could prove a vital insight for the government to focus on this gap. When looking at gender specific rates, for boys it lowers to 55% and for girls it is significantly higher at 61%. When attendance ratios drop so largely like this it is then imperative to look at reasons for dropping out or discontinuance of education, especially when girl’s rates of out-of-school or discontinuance are consistently higher (UNICEF, 2014). This will be discussed in 4.2.1.
Table 6. Age-Specific Attendance Ratio in 2015.
| Age group | Rural | Urban | Total | ||||
| Male | Female | Male | Female | Male | Female | Total | |
| 6-13 | 90 | 88 | 92 | 91 | 90 | 89 | 90 |
| 14-17 | 75 | 72 | 81 | 83 | 77 | 75 | 76 |
| 18-23 | 32 | 24 | 40 | 38 | 35 | 28 | 32 |
| 24-29 | 4 | 2 | 6 | 3 | 4 | 2 | 3 |
Source: Government of India, Ministry of Statistics and Programme Implementation, National Sample Survey Office, (2015). Key Indicators of Social Consumption in India Education. New Delhi, p. 14.
Another important indicator is the Gender Parity Index (GPI), which was on target for all of the levels below higher education (at 1.03 for classes I through XII). However, when it comes to higher education it drops to 0.89. This again shows the gender gap in higher education (see Appendix 8 for full index).
4.1.2 Difference in subjects taught and chosen
According to Becher (1981)”…academic subjects are not neutral; they are cultures, each with its own way of perceiving and interpreting the world” (cited by Thomas, 1990, p. 7). Chanana (2006, p. 269) states that until the early 1990’s, women studied higher education mainly in the fields of general education or in arts subjects. Now, they enter into new and traditionally ‘masculine’ disciplines (UNESCO, 2006). Data is generally unavailable for specific picked subjects at standard secondary level. However, when looking at the pass rate for girls and boys at standard secondary, girls tend to outperform boys. Data shows that consistently over three years more girls are passing. In 2009, the girls pass rate is nearly 10% higher. Moving on to higher secondary, data is easier to find on subject choice. From the MHRD 2010 exam results, table 7 has been created.
Table 7. Subject share of higher secondary pass students (%) in 2010.
| Subject Share of Pass Students (%) |
Arts | Commerce | Science | Vocational |
| Boys | 30.9 | 22.0 | 43.3 | 0.2 |
| Girls | 46.8 | 20.2 | 30.8 | 0.1 |
| Total | 38.3 | 21.2 | 37.5 | 0.1 |
Source: Government of India, Ministry of Human Resource Development, (2012). Results of High School and Higher Secondary Examinations 2010. New Delhi, p.XII-42.
Science has the second largest gender gap, of 12.5%. This could be due to the marginalisation of girls in Indian society, in a patriarchal society, even when girls are encouraged to learn, it is still seen as more beneficial to study an arts subject (this is explored further in chapter 4.2.2). This could explain the largest gender gap in higher secondary, arts subjects, where there are 15.9% more girls passing than boys. Statistics on higher education are unfortunately extremely poor and private institutions lack transparency (Chanana, 2006). However, in Appendix 9, at undergraduate level the pass students who were women can be seen. From these results it can be seen that women had the highest pass rate in Education, with the second highest being Arts, and then Science. However, these rates were still low and the total percentage of women who passed was just 47.34% (University Grants Commission, 2013).
Literacy rates can be a huge indicator to tell a story of what is happening on the ground at the time. Literacy rates tend to have the largest gender gap in India from the indicators used for this research. The MDGs Goal 2: Achieve Universal Primary Education and Goal 3: Promote Gender Equality and Empower Women both use measures of literacy. Goal 2 looks at the literacy rate of 15-24 year olds and Goal 3 looks at the literacy rate of women to men, 15-24 year olds. In India, the 2011 household census literacy definition was “a person aged seven years or above who can both read and write with understanding in any language is taken as literate”. Literacy is seen as the precondition to socio-economic and political development.
When looking at literacy rates in India, different statistics can give different outlooks. The first statistics analysed are from the 2011 household census in India. This census looks at literates from the age of seven upwards, so includes UNESCO’s gap of eight years from the 15+ data.
Table 8. Literacy Rates by gender in 2011.
| Whole Country | Rural | Urban | |
| Total | 72.99% | 67.77% | 84.11% |
| Male | 80.89% | 77.15% | 88.76% |
| Female | 64.64% | 57.93% | 79.11% |
Source: Census of India, (2011). CensusInfo India 2011 Final Population Tools. [online] Available at: http://censusindia.gov.in/2011census/censusinfodashboard/index.html [Accessed 8 Feb. 2016].
The female literacy rate, even in 2011, falls behind the male literacy rate, with a gap of 16.25%, way above the target of 10%. This, however, does not give a complete picture of the situation. When these figures are broken down into rural and urban areas, a different situation emerges. The gender gap in literacy rates in urban India is 9.65%, so within the target. The gender gap in literacy rates in rural India is more than double that, it is 19.22%. This shows that although the Saakshar Bharat (discussed in chapter 4.2.3) has done great work in a lot of areas, they would not have reached the target for the national literacy rate of 80% nor the 10% or below gender gap. The full literacy rates compared with the 2001 census can be found at Appendix 10. The lowest districts for female literacy can also be found at Appendix 11.
However, when looking at a different data set of literacy rates, UNESCO’s data shows a different story. The Youth Literacy Rate (15-24 years) and the Adult Literacy Rate (15 years +) is not broken down into urban and rural however it is broken down into male and female. When looking at the Adult Literacy Rate (ALR) in 2011 from UNESCO’s Databank the total population ALR was 69.3% compared to the India Household Census rate of 72.99%. The gender gap in UNESCO’s data is 19.6%, which is just under 3% higher than the Household Census gender gap. The Gender Parity Index for the ALR was only 0.75 in 2011.
Table 9. Adult Literacy Rate by year from 1991 to 2015.
| ALR by Year | Both Sexes | Male | Female |
| 1991 | 48.22 | 61.64 | 33.73 |
| 2001 | 61.01 | 73.41 | 47.84 |
| 2006 | 62.75 | 75.19 | 50.82 |
| 2011 | 69.3 | 78.88 | 59.28 |
| 2015 | 72.13 | 80.95 | 62.84 |
Source: UNESCO Data Centre, (2016). UIS Statistics. [online] Available at: http://data.uis.unesco.org/ [Accessed 8 Feb. 2016].
However, the Youth Literacy Rate (YLR) from UNESCO’s data shows a far more positive situation. The Gender Parity Index was 0.91, just 0.09 away from the global gender equality target. The gender gap in 2011 was 8.19%, completely under the Saakshar Bharat target. This could be due to changing attitudes in a new generation of people, different priorities for females, and an emerging society. Another useful insight from UNESCO is it’s calculation of the Youth Illiterate Population, which had a disturbing 60% of whom were female.
Table 10. Youth Literacy Rate by year from 1991 to 2015.
| YLR by Year | Both Sexes | Male | Female |
| 1991 | 61.9 | 73.51 | 49.35 |
| 2001 | 76.43 | 84.19 | 67.75 |
| 2006 | 81.13 | 88.41 | 74.36 |
| 2011 | 86.14 | 90.04 | 81.85 |
| 2015 | 89.65 | 91.83 | 87.24 |
Source: UNESCO Data Centre, (2016). UIS Statistics. [online] Available at: http://data.uis.unesco.org/ [Accessed 8 Feb. 2016].
4.1.4 Early marriage rates
Another factor influencing girls’ education in India is early and child marriage. In 2015 in India, 47% of girls were married by age 18, and 18% were married by the age of 15 (UNICEF, 2015). India has the highest number of child brides worldwide (due to population size); rates can vary between states and can be as high as 69% (Bihar) and 65% (Rajasthan) (Girls Not Brides, 2016). Child marriage is more common in rural areas (56%) than urban (29%), and there are a number of major factors contributing to early marriage including: economic considerations; gender norms and expectations for girls; concern for girls’ safety and family honour; and a lack of educational opportunities for girls (Girls Not Brides, 2016). UNICEF’s definition of child marriage prevalence is the percentage of women aged 20 – 24 who were married or in union before they were 18 years old.
4.2 Explanatory phase using qualitative methods
This section will look at qualitative findings during the explanatory phase to emphasise the other side of the story. It will look at policies, grassroots movements and various quantitative studies, analysing data like dropout rates, studies done on subject choice and gender, the impact of conditional cash transfers on marriage rates, and grassroots and government movements to improve literacy.
In the effort to achieve the target of 30% GER by 2020, the government launched the Rastriya Madhyamik Shiksha Abhiyan (RMSA) (2009) (National Secondary Education Mission), in the effort to universalise secondary education and rapidly expand lower secondary school and upper secondary school. This mission also aimed to provide more female teachers in schools and provide separate toilet blocks for girls. The Rashtriya Uchha Shikshya Abhiyan (RUSA) (2013) (National Higher Education Mission) aims for the expansion and improvement of colleges and universities. There have also been multiple other interventions implemented, mainly by the Ministry for Women and Children, including the Rajiv Gandhi Scheme for Empowerment of Adolescent Girls, which aimed to empower girls aged 11-18 through multiple strategies including mainstreaming of out of school girls into the educational process (UNICEF, 2014).
When looking at transition rates and GERs it is also important to consider drop-out rates at various levels. Drop-out rates can have a drastic impact on the GER at any level of education as such a high number of students drop out before completing even lower secondary school. It is vital to look at drop out and discontinuance rates. The National Sample Survey (2015) looked at the education-discontinuation population and described this sample as each person aged 5-29 years old who had ever been enrolled but was currently not attending an educational institution. Below is a table to show the major reasons for discontinuance of education and the numbers are very interesting. The largest overall reason for girls stopping education was being engaged in domestic activities. This perhaps reveals that policy changes should be focused more on interventions that help the burden of girls at home, for example free childcare or the education of a household to share responsibilities between males and females equally. The percentage for domestic activities is nearly double the first two indicators, not being interested in education and financial constraints, the second of which is regularly cited as a main reason for girls not going to school. As UNICEF (2014) found, a significant percentage of out of school girls are the eldest female child in their families, probably due to domestic responsibilities. There is most definitely a rural/urban divide, especially with regards to domestic activities, with nearly 10% more rural girls citing it as a reason. Another interesting statistic from this survey is the indicator of marriage, which is 5% higher in urban areas, something which would not be expected as early marriage rates are higher in rural areas. The level wise dropout rate can be found at Appendix 12.
Table 11. Major reasons for discontinuance of education (%).
| Rural | Urban | Total | ||||
| Male | Female | Male | Female | Male | Female | |
| Not interested in education | 25.1 | 16.2 | 20.8 | 14.3 | 23.8 | 15.6 |
| Financial constraints | 23.6 | 15.4 | 23.7 | 14.9 | 23.6 | 15.2 |
| Engaged in domestic activities | 5.9 | 32.9 | 2.4 | 23.1 | 4.8 | 29.7 |
| Engaged in economic activities | 29.9 | 3.9 | 33.6 | 6.9 | 31.0 | 4.9 |
| School is far off | 0.6 | 4.2 | 0.2 | 1.8 | 0.5 | 3.4 |
| Unable to cope with studies | 5.5 | 5.1 | 5.3 | 3.6 | 5.4 | 4.6 |
| Completed desired level | 4.5 | 4.3 | 8.3 | 11.3 | 5.7 | 6.5 |
| Marriage[5] | N.A | 12.4 | N.A | 17.1 | N.A | 13.9 |
| Others[6] | 4.8 | 5.7 | 5.8 | 7.0 | 5.1 | 6.2 |
Source: Adapted to percentages from Government of India, Ministry of Statistics and Programme Implementation, National Sample Survey Office, (2015). Key Indicators of Social Consumption in India Education. New Delhi, p. 26.
According to Tilak and Biswal (2015), the widening of access to higher education is essential for societies struggling to overcome socio-economic inequalities. Jain (2003) evaluated the Shikshakarmi Project started in 1987. Shikshakarmis are education workers, and this programme sought to address the factors stopping educational development in Rajasthan. In Rajasthan the literacy rate was extremely low and there was a huge indifference towards girls’ education. The scheme created Angan Pathshala (courtyard schools) which created education with easy access for girls to primary education within a safe distance. There was also Mahila Sahyogis (female helpers/escort) who would be local women who would escort the child to the school and back, and who would also look after younger children during school hours. The Mahila Task Force was also created, to act as a bridge between the aforementioned projects and state-level functionaries. The Shikshakarmi Project did succeed in the near complete enrolment of girls in Rajasthan however more girls still drop out and it did not succeed in stopping the patriarchal pattern in that area (Jain, 2003).
Girls living further from schools find it more difficult to travel there as parents feel uneasy about the long journey. As part of the Sarva Shiksha Abhiyan (SSA) (a scheme for universal primary education), the government launched Kasturba Gandhi Balika Vidyalaya (KGBV) which focused on encouraging girls to go to upper primary school. This was a centrally sponsored scheme which opened residential schools and provided residential facilities for existing schools (UNESCO and Adhayan, 2007). Another scheme implemented by the government and cited by UNESCO and Adhayan (2007) is reward schemes. For instance, one scheme focused on secondary and higher secondary level and gave girls bicycles on completion of certain levels of education. This had two objectives, to make them independent and to give them increased mobility. In Tamil Nadu, within just two years 96,000 bikes were given to all Dalit[7] girls who passed class X. A similar initiative was introduced in Jharkhand for girls completing class X (UNESCO and Adhayan, 2007). This gives female students another incentive to do well in school and attend more often. It also allows them a safer journey to school where the school is not nearby.
4.2.2 Difference in subjects taught and chosen
When looking at the education for females in a developing country, there are many indicators that can influence a variety of variables. The Organisation for Economic Co-operation and Development (OECD) uses an international survey called the Programme for International Student Assessment, and published a study called The ABC of Gender Equality in Education. They address a number of factors which may contribute to gender gaps in education. PISA found that young men are more likely to be less engaged with school and actually are more likely to be low achievers. However, females are more likely to have less self-confidence in their ability to solve maths or science problems. PISA found that girls do better when they are working on maths or science problems that are similar to what they do in school. When asked to “think like scientists”, girls under perform considerably (OECD, 2015). Across OECD participating countries, boys perform higher than girls in mathematics by the equivalent of nearly five months of school. They hypothesised that when students are more self-confident, they give themselves the freedom to fail (OECD, 2015). PISA also found that parents were more likely to expect their sons to go into a career of science, technology, engineering or maths even when their boys and girls were performing at the same level in mathematics. They state that the results strongly suggest that gender gaps in school performance are not determined by differences in ability (OECD, 2015).
Chanana (2006) found that because a science degree required a longer investment of time and money it was seen as less desirable for a female to enter into this discipline. However, an undergraduate degree still helps in the marriage market by raising social status, so, women go on to study arts and humanities as these are cheaper and shorter courses (Chanana, 2006). This shows why there also may be less girls at secondary and higher secondary in the more “professional” courses of science, engineering and information technology. This again involves the feminist theory of gendered subjects. On the other hand, more women than ever in India are entering private self-financing institutions and studying in both new and traditionally labelled ‘masculine’ disciplines (Chanana, 2006, p. 269).
In 1988, the Government of India introduced a nationwide programme called the National Literacy Mission (NLM), which aimed to educate 80 million adults between the ages of 15-35 over an 80 year period. They defined literacy as not only reading, writing and counting but also helping people to understand why they are deprived and so help them towards change. The NLM had made 127.45 million people literate by the end of the 10th plan period (2007), and 60% of these people were female. They covered 597 districts under the Total Literacy Campaign, 485 of those under the Post Literacy Programme and 328 under the Continuing Education Programme. The NLM was subject to extensive external review and evaluation, and was found to have problems in design, architecture, and mode of implementation, non-viability of a single pan Indian solution, limited voluntary approach, limited involvement of state government in the programme, lack of convergence , weak management of structures, lack of community participation, poor monitoring, and inadequate funding. While this was happening, the government announced literacy would be its key instrument for the emancipation and empowerment of women, as efforts to give rise to school education, health, nutrition, skill development and women’s empowerment were impeded by female illiteracy (Department of School Education and Literacy, 2009).
Under the NLM, the Saakshar Bharat was also set up as a government initiative to create a literate society through teaching and learning programmes for non-literates and neo-literates over the age of 15. It was launched in 2009 as a centrally sponsored scheme and aimed to recast the NLM to focus on the literacy of women. The NLM ended in September 2009 to pass focus onto the Saakshar Bharat. Originally, it chose six villages for the Model Adult Education Centres in the Karimnagar district in the Telangana state (Department of School Education and Literacy, 2009). The scheme aimed to create awareness of social disparities, and aimed for an 80% literacy rate by 2012 nationally, with a gender gap in adults of 10% or below. There were also four broader objectives which included imparting functional literacy and numeracy to non-literates, acquiring equivalency to formal educational system, imparting relevant skill development programmes, and promoting a learning society by providing opportunities for continuing education.
Their mission was to impart functional literacy to 70 million non-literate adults aged 15 years or over, covering 60 million women. The eligibility criteria to be covered by the Saakshar Bharat scheme were: i) a district with an adult female literacy rate below 50% in the 2001 census, ii) all left-wing extremism-affected districts, iii) only covers rural areas. There were 365 districts with a female adult literacy rate below 50%, and 35 districts affected by left-wing extremism. However, since 2001, multiple eligible districts were bifurcated or trifurcated meaning there were 410 districts eligible in total.
In the Saakshar Bharat Mission, women were the prime focus and major participants (Government of India, 2009). The approach was to build on women’s existing knowledge and levels of literacy and numeracy. Women in large numbers were volunteers and instructors to encourage female participation. The Mission launched huge social motivation and mobilisation campaigns to promote the benefits of being literate and the drawbacks of being non-literate. A variety of teaching and learning programmes including the Functional Literacy Programme, the Basic Education Programme, the Vocational Education Programme and the Continuing Education Programme were set up under the scheme (for learner numbers, see Appendix 13). The Lok Shiksha Kendra would be the operations side of the mission at the ground level, and would be responsible for delivering the entire range of activities. To motivate learners, successful students were awarded with certificates to show their knowledge (Jain, 2003).
UNICEF, international laws, treaties and conventions define child/early marriage as a formal or informal union where one or both parties are under 18 years old. In India, the legal ages of marriage are 18 for girls and 21 for boys according to the Prohibition of Child Marriage Act in 2007. In USAID’s Child, Early and Forced Marriage Resource Guide, it was found that delaying marriage can improve women’s health and their families by delaying sex, pregnancy and childbearing; boost girls chances of staying in school; reduces the risk of exposure to violence; and increases decision making power (Glinski, Sexton and Meyers, 2015, p. 5). Child, early and forced marriage (CEFM) can be a cause and a consequence of school dropout and there is a strong correlation between CEFM and low school attainment (Glinski, Sexton and Meyers, 2015). Girls with only a primary school education are twice as likely to marry or enter a union under 18 as those who have secondary or higher education, and girls with no education are three times more likely to (Glinski, Sexton and Meyers, 2015). Married girls are more likely to face social and physical isolation which translates to a lack of control over resources and restricted access to social networks.
CEFM can have a huge impact on personal and national economics. For each year of primary schooling, a woman’s wage later in life increases by 10-20%, and for each year of secondary it increases by a further 15-25%. According to Glinski, Sexton and Meyers (2015), Plan International estimated in 2008 that in 65 low and middle income countries, more than $92 million is lost globally each year because girls do not have the same secondary school attainment as boys. In India specifically, girls marrying before 15 had decreased but girls marrying before 18 had increased (Glinski, Sexton and Meyers, 2015). Glinski, Sexton and Meyers also found that education is strongly correlated with early marriage, in India among women aged 20-24, 77% of those with no education and 62% of those with only primary education were married by the age of 18, compared with only 27% of those who had secondary or higher education (Glinski, Sexton and Meyers, 2015).
In 1994, the government of the state of Haryana implemented a conditional cash transfer programme titled Apni Beti Apni Dhan (ABAD) (Our Daughter, Our Wealth). This provided families with a small payment upon the birth of an eligible girl and a bond redeemable if the girl remained unmarried by the age of 18 (Nanda, Datta and Das, 2014). The scheme targeted poorer households and disadvantaged caste groups, and offered two separate transfers: 1) a small cash transfer of 500 Indian rupees (Rs) within 15 days of delivering a girl; and 2) within three months of birth and on enrolment, a government purchased savings bond of Rs.2,500 in the name of the daughter, redeemable at a maturity of Rs.25,000 at age 18, provided the girl was unmarried (Nanda, Datta and Das, 2014). USAID funded an assessment of the programme as the first beneficiaries turned 18 in 2012. The assessment was titled Impact on Marriage: Programme Assessment of Conditional Cash Transfers (IMPACCT). IMPACCT hypothesised attitudes of parents would become more gender equal due to the observation that their government was willing to invest in the future development of girls, parents and girls who chose to pursue the terms required to receive payment would have intensified aspirations for a better future, while waiting to receive benefits and remain unmarried, girls will stay longer in schools and thus have higher educational attainment (Nanda, Datta and Das, 2014).
IMPACCT found that there had been vast improvements in girls’ education in Haryana where in 2014 two thirds of girls aged 15-17 were in secondary schools compared to 2005 when less than 50% were. The assessment found that a larger proportion of beneficiary girls (older cohort) remained in school, as can be seen in Table 9. The study found a higher number of non-beneficiary girls dropped out during primary school (27%) than beneficiary girls (19%). This could be due to a number of factors, including parent’s aspirations and investments in girls’ education being controlled by the notion of girls being the wealth of their marital home (Nanda, Datta and Das, 2014).
Table 12. Girls’ status of current education, CCT beneficiaries vs. non-beneficiaries.
| Beneficiary Girls | Non-Beneficiary Girls | |
| Currently in School | 76% | 63.6% |
| Dropped Out | 22.7% | 33.4% |
| Never Been | 1.3% | 3.0% |
| Total | 100% | 100% |
| No. girls surveyed | 2,622 | 3,072 |
Source: Nanda, P., Datta, N. and Das, P. (2014). Impact on Marriage: Program Assessment of Conditional Cash Transfers on Girls’ Education, p. 4.
Other indicators of investment into girls education include: amount of time spent studying at home; tuition support (outside of school fees); and type of schools their male siblings go to (Nanda, Datta and Das, 2014). Ultimately, the assessment found that the effect of the ABAD on girls’ education was “positive and strongly significant” and being a beneficiary increased the probability of being in school after the age of 15 by 23% (Nanda, Datta and Das, 2014).
4.3 Summary of findings
The GER dropped significantly from not only secondary to higher secondary but also higher secondary to higher education. The probabilities for females transitioning to higher education were shockingly low, even though the pass rates for higher secondary at both years were higher for girls than boys by a considerable amount. The GAR also dropped by a large amount between secondary to higher secondary and to above higher secondary. Again this shows that policy recommendations need to be aimed at the children leaving secondary school.
India has implemented a number of policies and interventions at secondary and further education levels to improve gender inequality but the consistent problem comes down to implementation. Dropout rates for girls are still extremely high and the current interventions do not address the root of the problem. Domestic activities were cited as the largest reason for girls dropping out, so it poses the question, why has policy not been focused on this already? The Shikshakarmi Project made a difference not only to low literacy and transition rates but also social attitudes towards girls’ education in rural areas. However, again, implementation was the major downfall of this project and others related to it.
4.3.2 Difference in subjects taught and chosen
Again, girls are tending to outperform boys at secondary level as can be seen from the findings in 4.1.2. From the subject share of pass students at higher secondary, there is a significant difference in the subject choice, with a gap of over 15% in Arts and over 12% in Science. This was again reflected at undergraduate level. This shows that there are still gender stereotypes surrounding subject choices within further education. Girls were also found to have lower self confidence in the more “masculine” subjects. Education of girls was also used as a tool to improve marriage prospects, rather than improve a girl’s life, and thus the subjects chosen were not for a career but more social status.
The largest gender gap found in this study was within literacy rates. Females consistently prove to be more illiterate than men, in each source of data and in both urban and rural areas. Illiteracy can be a massive barrier to girls’ confidence in education and their own abilities. The most significant difference was in rural areas between males and females, showing that interventions are more important in these areas. The youth illiterate population was 60% female, another worrying statistic. The government’s various projects and plans on literacy have definitely made an impact specifically on females however, once again implementation was the downfall. The NLM did cover 60 million women but the majority of these were adult learners, and although literacy impacts daily life a huge amount, it is not known whether the scheme encouraged these adult learners to improve their formal education.
Early marriage has been found to be one of the larger influencing factors on a girls’ education. In rural areas the early marriage rate was nearly twice as high as the rate in urban areas. Across India, 47% of girls are married before the age of 18. The most effective scheme for lowering early marriage rates was the conditional cash transfers, which changed parent’s perspectives on their daughters and their value. The ABAD programme was hugely successful, and the results definitely show in the difference between beneficiaries and non-beneficiaries remaining in school.
CHAPTER FIVE: Conclusion and Discussion
This research aimed to examine female education in India, to examine why there were gender gaps, and what may be done to improve the situation. The study has been successful in learning the reason behind gender inequalities in education in India. It has found that multiple, cross-sectoral policies would need to be implemented to have the largest impact on the gender gap in further education in India. From using multiple indicators, the research was able to study the broader situation in India, not just one aspect of education. However, to make in depth recommendations, it would be advised to study each level of education in detail. The research found that the main reason behind the government policies lack of impact on gender inequality is implementation. A restructuring of the most important aspects of the education system would need to happen over the next few years so that another generation of women are not left behind.
Unterhalter et al. (2014) hypothesised that the development and implementation of interventions to improve girls schooling and enhance gender equality are affected by aspects of context at local, national and global levels. They found three kinds of interventions that worked best:
- Interventions which focus on resources and infrastructure
- Interventions which focus on changing institutions
- Interventions which focus on changing norms and to include the most marginalised in education decision making
The effectiveness of interventions focusing on resources and infrastructure depends on the targeting of educationally under-resourced families and focusing on the girls who are most at risk. These interventions are more likely to be linked with girl’s attendance, enrolment and grade attainment. Successful interventions and policies must have the existence of corresponding legal and regulatory frameworks, and the state capacity to implement policy (Unterhalter et al., 2014).
To improve transition rates, the following policy recommendations have been made:
- A reduction in the cost of sending females to school including: free textbooks and uniforms, scholarships for female students (this would also show communities that the government values girls, not just boys), and free school boarding facilities. These interventions would improve transition rates, as well as attendance ratios, enrolment rates and even the academic performance of female students.
- The creation of women’s colleges and universities, given the socio-cultural make up of Indian society, would increase access for girls to further education as parents would be more comfortable sending female students to these establishments (Ministry of Human Resource Development, 2013).
- Admission procedures into further education have no uniformity. This creates a distorted growth path and unequal access to higher education (Tilak and Biswal, 2015, p. 58). Therefore, a structural adjustment of entrance examinations would benefit not only marginalised students but also female students.
- Another major factor in determining whether girls can access education is the distance of the educational centre from their home or village. Providing schools within a community or in the surrounding area would greatly expand girls schooling (Khalid, 2008).
- A policy to subsidize child care could contribute to reducing the burden of domestic responsibilities (Khalid, 2008), as girls are often obliged to look after their younger siblings. This type of scheme and policy would have a massive impact on mainly enrollment rates but also attendance rates and would probably filter upwards to enable girls to go to higher secondary and tertiary education.
- The interventions focusing on changing institutions emphasize the importance of teachers who are supported to improve girls schooling. This requires concern with gender equality in teaching, learning and management, attention to curriculum, learning materials and pedagogical practices for schools and classrooms and close attention to local context (Unterhalter et al., 2014).
5.2.2 Difference in subjects taught and chosen
To reduce the gender gap in “masculine” subjects, it would be advised the following policies are implemented:
- There is a major need for attitude shifts in the Indian society, facilitated by policy and reinforced by freshly designed development indicators (Jain, 2003, p. 32). The state-run educational programmes do not see gender equality as its direct agenda, and yet education should serve as “a catalyst for emancipatory struggles and simultaneously prepare boys to accept girls as equal” (Jain, 2003, p. 28). Jain (2003) also found that there is a growing realisation for the need to reinterpret roles and expectations of boys and men and to utilise their active participation in changing stereotypes. As women become recognised as equal and capable, their parents and teachers will encourage them to go into more “masculine” subjects and onto higher education to improve their human capital.
- Cash or scholarship incentives for girls going into scientific, mathematic or engineering subjects could raise the amount of females going on to study these subjects at higher levels.
To reduce gender inequalities in literacy rates, specifically in rural areas, the subsequent recommendations have been made:
- A mother’s education had a greater impact on a girl’s education and so investment in female schooling, adult education and adult literacy would lead to a reduction in the gender gap (Khalid, 2008).
- A stronger focus on girl’s literacy in school, and schemes for out of school girls to improve their literacy would help to reduce the gender gap in literacy rates. The schemes for out of school girls could be more directed towards rural areas as they have a larger gender gap.
5.2.4 Early marriage rates
Early and child marriage remains a particularly important factor in determining a girl’s education, and therefore the following recommendations have been made:
- Laws regarding the age of marriage and child labour would go a long way to changing the sociocultural norms in India. However, these laws would only be effective if they are well formulated and strictly implemented (UNICEF, 2014). As has been discussed previously, the laws regarding age of marriage and the surrounding laws have not been implemented strongly enough. Child marriage and child labour laws would ultimately impact transition rates and enrolment ratios.
- Conditional Cash Transfer schemes seem to have been extremely effective in preventing early and child marriage and have therefore enabled girls to stay in school longer.
5.3 Limitations and future suggestions
In future studies, additional time would need to be spent looking in-depth at discrepancies between states. As this dissertation is written for undergraduate level, it would have been too complex to go into such detail, and unfeasible to do field research or primary research. The policy reforms and interventions suggested will only give a brief overview compared to a detailed, structured, localised approach. It would also be recommended that other grassroots interventions would be studied in the future as these tend to have a large impact at least at community level. Further research could look at the difference between rural and urban areas in more depth, and in addition, the difference between financial classes, as these could have vastly different outcomes. It would be practical to look at government expenditure in different areas of education with a focus on gender, as this could show the efforts being made by the government. Unemployment and employment rates with a reference to levels of education would be constructive to observe in another study. There is a wide difference between the further education rates and higher/tertiary education rates which could also be explored in more depth.
Bibliography
Becher, T. (1981) Towards a Definition of Disciplinary Cultures. Studies in Higher Education, 6 (2), pp. 109-122.
Bhaumik, S. and Chakrabarty, M. (2011). Whither Human Capital? The Woeful Tale of Transition to Tertiary Education in India. The William Davidson Institute, pp.4-6.
Census of India, (2011). CensusInfo India 2011 Final Population Tools. [online] Available at: http://censusindia.gov.in/2011census/censusinfodashboard/index.html [Accessed 8 Feb. 2016].
Chanana, K. (2006). Gender and Disciplinary Choices in India. In: G. Neave, ed., Knowledge, Power and Dissent. Critical Perspectives on Higher Education and Research in Knowledge Society. Paris: UNESCO, pp.267, 269-270, 276, 287, 290.
eNotes, (2016). Sociology of Education Theory: Feminist Perspectives Research Paper Starter – eNotes.com. [online] Available at: http://www.enotes.com/research-starters/sociology-education-theory-feminist-perspectives [Accessed 15 Feb. 2016].
Girls Not Brides, (2015). Letting girls believe in their dreams again. Usha’s story, India – Girls Not Brides. [online] Available at: http://www.girlsnotbrides.org/girls-voices/letting-girls-believe-in-their-dreams-again-ushas-story-india/ [Accessed 22 Feb. 2016].
Girls Not Brides, (2016). India – Child Marriage Around The World. Girls Not Brides. [online] Available at: http://www.girlsnotbrides.org/child-marriage/india/ [Accessed 1 Feb. 2016].
Glinski, A., Sexton, M. and Meyers, L. (2015). The Child, Early, and Forced Marriage Resource Guide. US Aid. [online] Washington DC: Banyan Global. Available at: https://www.usaid.gov/documents/1865/child-early-and-forced-marriage-resource-guide [Accessed 1 Jan. 2016].
Government of India, Ministry of Human Resource Development, (2009). Rashtriya Madhyamik Shiksha Abhiyan (National Secondary Education Mission).
Government of India, Ministry of Human Resource Development, (2009). Saakshar Bharat. New Delhi.
Government of India, Ministry of Human Resource Development, (2012). Results of High School and Higher Secondary Examinations 2010. New Delhi, pp.X-41-42, XII-42,48.
Government of India, Ministry of Human Resource Development, (2013). Rashtriya Uchha Shiksha Abhiyan (National Higher Education Mission). pp.12, 28, 90.
Government of India, Ministry of Human Resource Development, (2014). Educational Statistics at a glance. New Delhi.
Government of India, Ministry of Statistics and Programme Implementation, National Sample Survey Office, (2015). Key Indicators of Social Consumption in India Education. New Delhi, pp.8, 12, 14, 25-26.
Government of India, Ministry of Women and Child Development, (2001). National Policy for the Empowerment of Women.
Jain, S. (2003). Gender equality in education. Community based initiatives in India. Education for All Global Monitoring Report 2003/4. UNESCO.
Jayaweera, S. (1997) Education and Empowerment in Asia. Gender and Education, 9(4) pp. 411-423.
Kabeer, N. (1994). Reversed Realities: Gender Hierarchies in Development Thought. London: Verso.
Kabeer, N. (1999). Resources, Agency, Achievements: Reflections on the Measurement of Women’s Empowerment. Development and Change, 30(3), pp.435-464.
Khalid, U. (2008). Gender Bias in Education : Evidence from Rural India. Undergraduate. University of New South Wales.
Khan, S. (1993). Chapter 6, South Asia. In: E. King and M. Hall, ed., Women’s Education in Developing Countries, 1st ed. Published for the World Bank by John Hopkins University Press, pp.224, 226, 236-237.
Lall, M. (2005). The Challenges for India’s Education System. Chatham House, p.6.
Lee, R. M. (2000). Unobtrusive Methods in Social Research. Buckingham: Open University Press.
Letherby, G. (2003). Feminist research in theory and practice. Buckingham: Open University Press.
Nanda, P., Datta, N. and Das, P. (2014). Impact on Marriage: Program Assessment of Conditional Cash Transfers on Girls’ Education, pp. 1-7.
Nussbaum, M. (2000) Women’s Capabilities and Social Justice. Journal of Human Development. 1 (2), pp. 219-247.
OECD, (2015). The ABC of Gender Equality in Education: Aptitude, Behaviour, Confidence. PISA. [online] OECD Publishing. Available at: http://dx.doi.org/10.1787/9789264229945-en [Accessed 23 Jan. 2016].
Parsons, R. (2009). AS & A2 sociology complete revision and practice. Kirkby-in-Furness: Coordination Group.
Rathgeber, E. (1990). WID, WAD, GAD: Trends in Research and Practice. The Journal of Developing Areas, 24(4), pp.489-502.
Razavi, S. and Miller, C. (1995). From WID to GAD: Conceptual Shifts in the Women and Development Discourse. Geneva: UNRISD.
Strauss, J. and Duncan, T. (1995). Human Resources: Empirical Modeling of Household and Family Decisions. In: J. Behrman and T. Srinivasan, ed., Handbook of Development Economics, 1st ed. pp.1883-2023.
Summers, L. (1994). Investing in all the people. Washington, D.C.: World Bank.
Thomas, K. (1990) Gender and Subject in Higher Education. Milton Keynes, UK: SRHE/Open University Press, p. 7.
Tilak, J. and Biswal, K. (2015). The Transition to Higher Education in India. The Transition from Secondary Education to Higher Education Case Studies from Asia and the Pacific, pp. 47-50, 53-58, 62-63.
Tucker, J. (2011). Gender in World Politics. In: J. Baylis, S. Smith and P. Owens, ed., The Globalization of World Politics, 5th ed. New York: Oxford University Press, p.264.
UNESCO Data Centre, (2016). UIS Statistics. [online] Available at: http://data.uis.unesco.org/ [Accessed 8 Feb. 2016].
UNESCO, (2006). Knowledge, Power and Dissent – Critical Perspectives on Higher Education and Research in Knowledge Society. Paris: UNESCO Publishing, pp.267-290.
UNESCO and Adhayan, (2007). Lessons to Learn. Emerging Common Principles for Promoting Girls’ Education in South Asia. New Delhi: UNESCO Publishing, pp.1-2, 5-7, 31.
UNICEF, (2014). A Situational Study of India. Global Initiative on Out-of-School Children. New Delhi.
UNICEF, (2015). The State of the World’s Children.
United Nations Millennium Project, (2005). Taking Action: Achieving Gender Equality and Empowering Women. Task Force on Education and Gender Equality. Earthscan.
United Nations Millennium Project, (2005). Toward Universal Primary Education: Investments, Incentives, and Institutions. Task Force on Education and Gender Equality. Earthscan.
University Grants Commission, (2013). University Development in India – Examination Results 2010. New Delhi: Secretary, University Grants Commission, Bahadur Shah Zafar Marg, pp.1-2.
Unterhalter, E., North, A., Arnot, M., LLoyd, C., Moletsane, L., Murphey-Graham, E., Parkes, J. and
Saito, M. (2014). Interventions to enhance girls’ education and gender equality. Education Rigorous
Literature Review. Department for International Development.
Vella, F. (1993). Gender Roles, Occupational Choice and Gender Wage Differential. The Economic Record, 69(207), pp.382-392.
Willis, K. (2011). Theories and Practices of Development. 2nd ed. Abingdon, Oxon: Routledge.
Young, K. (1993). Planning Development with Women: Making a World of Difference. New York: St. Martin’s Press.
Appendices
Appendix 1. Level wise enrolment (in 100,000s) in 2014
Appendix 2. Transition probabilities at various levels of education
Appendix 3. Distribution of educational attainment (%) in 2011
Appendix 4. Secondary school pass rate 2005-2010 (%)
Appendix 5. Upper secondary pass rate 2005-2010 (%)
Appendix 6. Class X 2010 exam results
Appendix 7. Class XII 2010 exam results
Appendix 8. Gender Parity Index (2013-14 school, 2012-2013 higher education)
Appendix 9. Undergraduate exam results 2010 (pass students) by subject
Appendix 10. Literacy Rates 7+ years (2001/2011)
Appendix 11. Lowest districts for female literacy rate (under 60%) 2011
Appendix 12. Level wise dropout rate 2013-2014 (%)
Appendix 13. Saakshar Bharat Scheme learner numbers
Appendix 1. Level wise enrolment (in 100,000s) in 2014
| I-V Primary | VI-VIII U. Primary | IX-X Secondary | XI-XII Higher Secondary | Higher Education | |||||||||||
| Boys | Girls | Total | Boys | Girls | Total | Boys | Girls | Total | Boys | Girls | Total | Boys | Girls | Total | |
| 2008-2009 | 706 | 647 | 1353 | 314 | 270 | 584 | 165 | 130 | 294 | 95 | 74 | 169 | 112 | 73 | 185 |
| 2009-2010 | 697 | 639 | 1336 | 317 | 278 | 595 | 169 | 138 | 307 | 99 | 79 | 178 | 124 | 83 | 207 |
| 2010-2011 | 701 | 646 | 1348 | 327 | 292 | 619 | 175 | 143 | 319 | 109 | 86 | 195 | 155 | 120 | 275 |
| 2011-2012 | 726 | 672 | 1399 | 331 | 299 | 630 | 186 | 155 | 341 | 116 | 94 | 210 | 162 | 130 | 292 |
| 2012-2013 (P) | 681 | 639 | 1321 | 329 | 314 | 643 | 181 | 162 | 343 | 106 | 92 | 198 | 163 | 133 | 296 |
Source: Government of India, Ministry of Human Resource Development, (2014). Educational Statistics at a glance. New Delhi, pp. 15-16. (‘P’ meaning provisional)
Appendix 2. Transition probabilities at various levels of education
| Male | Female | |||
| Rural | Urban | Rural | Urban | |
| Below primary to primary or higher | 0.59 | 0.76 | 0.32 | 0.58 |
| I-V to VI or higher | 0.70 | 0.80 | 0.53 | 0.71 |
| VI-VIII to IX-X or higher | 0.53 | 0.65 | 0.38 | 0.56 |
| IX-X to XI-XII or higher | 0.49 | 0.58 | 0.34 | 0.50 |
| XI-XII to higher education | 0.47 | 0.57 | 0.37 | 0.51 |
Source: Bhaumik, S. and Chakrabarty, M. (2011). Whither Human Capital? The Woeful Tale of Transition to Tertiary Education in India. The William Davidson Institute, p. 6.
Appendix 3. Distribution of educational attainment (%) in 2011
| Male | Female | |||
| Rural | Urban | Rural | Urban | |
| Less than Primary | 40.78 | 24.33 | 67.61 | 41.83 |
| I-V Primary | 15.24 | 13.45 | 11.81 | 13.08 |
| VI-VIII Upper Primary | 18.09 | 18.48 | 10.85 | 15.64 |
| IX-X Secondary | 11.32 | 14.94 | 5.36 | 11.52 |
| XI-XII Higher Secondary | 6.70 | 9.72 | 2.37 | 6.63 |
| Higher Education | 7.87 | 19.08 | 2.00 | 11.30 |
| Sample Size | 58,027 | 31,709 | 58,834 | 31,127 |
Source: Bhaumik, S. and Chakrabarty, M. (2011). Whither Human Capital? The Woeful Tale of Transition to Tertiary Education in India. The William Davidson Institute, p. 6.
Appendix 4. Secondary school pass rate 2005-2010 (%)
| Boys | Girls | Total | |
| 2005 | 61.4 | 67.6 | 63.8 |
| 2006 | 66.2 | 70.2 | 67.9 |
| 2007 | 68.3 | 73.1 | 70.3 |
| 2008 | 65.0 | 70.5 | 67.4 |
| 2009 | 65.3 | 74.3 | 69.2 |
| 2010 | 72.6 | 76.6 | 74.3 |
Source: Government of India, Ministry of Human Resource Development, (2012). Results of High School and Higher Secondary Examinations 2010. New Delhi, p. X-42.
Appendix 5. Upper secondary pass rate 2005-2010 (%)
| Boys | Girls | Total | |
| 2005 | 68.0 | 76.5 | 71.5 |
| 2006 | 69.9 | 76.9 | 72.7 |
| 2007 | 70.7 | 78.8 | 74.0 |
| 2008 | 68.4 | 79.5 | 73.0 |
| 2009 | 73.0 | 80.7 | 76.2 |
| 2010 | 72.7 | 80.8 | 76.2 |
Source: Government of India, Ministry of Human Resource Development, (2012). Results of High School and Higher Secondary Examinations 2010. New Delhi, p. XII-48.
Appendix 6. Class X 2010 exam results
| Boys | Girls | Total | |
| No. Students Passed | 6,860,000 | 5,680,000 | 12,540,000 |
| Percentage Students Passed (%) | 73.2 | 77.4 | 75.0 |
Source: Government of India, Ministry of Human Resource Development, (2014). Educational Statistics at a glance. New Delhi, p. 9.
Appendix 7. Class XII 2010 exam results
| Boys | Girls | Total | |
| No. Students Passed | 4,290,000 | 3,710,000 | 8,000,000 |
| Percentage Students Passed (%) | 73.2 | 81.5 | 76.8 |
Source: Government of India, Ministry of Human Resource Development, (2014). Educational Statistics at a glance. New Delhi, p. 9.
Appendix 8. Gender Parity Index (2013-14 school, 2012-2013 higher education)
| GPI | |
| I-V Primary | 1.03 |
| VI-VIII Upper Primary | 1.06 |
| I-VIII Elementary | 1.04 |
| IX-X Secondary | 1.00 |
| I-X | 1.03 |
| XI-XII Higher Secondary | 1.00 |
| I-XII | 1.03 |
| Higher Education | 0.89 |
Source: Government of India, Ministry of Human Resource Development, (2014). Educational Statistics at a glance. New Delhi, p. 8.
Appendix 9. Undergraduate exam results 2010 (pass students) by subject
| Faculty | Total | Women | % Women |
| Arts | 1,522,776 | 7,77,017 | 51.03 |
| Science | 425,531 | 214,664 | 50.45 |
| Commerce | 668,759 | 282,942 | 42.31 |
| Education | 357,646 | 217,663 | 60.86 |
| Engineering/Technology | 421,660 | 138,147 | 32.76 |
| Medicine | 103,197 | 49,851 | 48.31 |
| Agriculture | 11,188 | 2,836 | 25.35 |
| Veterinary Science | 1,445 | 349 | 24.15 |
| Law | 63,344 | 19,332 | 30.52 |
| Others | 147,501 | 59,636 | 40.43 |
| TOTAL | 3,723,047 | 1,762,437 | 47.34 |
Source: University Grants Commission, (2013). University Development in India – Examination Results 2010. New Delhi: Secretary, University Grants Commission, Bahadur Shah Zafar Marg, pp.1-2.
Appendix 10. Literacy Rates 7+ years (2001/2011)
| 2001 | 2011 | Change | |
| Total | 64.84 | 72.99 | +8.15 |
| Male | 75.26 | 80.89 | +5.63 |
| Female | 53.67 | 64.64 | +10.97 |
| Rural | 58.74 | 67.77 | +9.03 |
| Rural Male | 70.70 | 77.15 | +6.45 |
| Rural Female | 46.13 | 57.93 | +11.80 |
| Urban | 79.92 | 84.11 | +4.19 |
| Urban Male | 86.27 | 88.76 | +2.49 |
| Urban Female | 72.86 | 79.11 | +6.25 |
Source: Census of India, (2011). CensusInfo India 2011 Final Population Tools. [online] Available at: http://censusindia.gov.in/2011census/censusinfodashboard/index.html [Accessed 8 Feb. 2016].
Appendix 11. Lowest districts for female literacy rate (under 60%) 2011
| Andhra Pradesh | 59.15 |
| Arunadhal Pradesh | 57.70 |
| Bihar | 51.50 |
| Jammu and Kashmir | 56.43 |
| Jharkhand | 55.42 |
| Madhya Pradesh | 59.24 |
| Rajasthan | 52.12 |
| Uttar Pradesh | 57.18 |
Source: Census of India, (2011). CensusInfo India 2011 Final Population Tools. [online] Available at: http://censusindia.gov.in/2011census/censusinfodashboard/index.html [Accessed 8 Feb. 2016].
Appendix 12. Level wise dropout rate 2013-2014 (%)
| Boys | Girls | Total | |
| I-V Primary | 21.2 | 18.3 | 19.8 |
| I-VIII Elementary | 39.2 | 32.9 | 36.3 |
| I-X | 48.1 | 46.7 | 47.4 |
Source: Government of India, Ministry of Human Resource Development, (2014). Educational Statistics at a glance. New Delhi, p. 8.
Appendix 13. Saakshar Bharat Scheme learner numbers
| Activity | 2009-2010 | 2010-2011 | 2011-2012 | Total |
| Learners under the Literacy Programme – Basic and Post literacy | 10 million | 25 million | 35 million | 70 million |
| Learners under the Basic Education Programme | 100,000 | 600,000 | 800,000 | 15 million |
| Learners under the Vocational Education (Skill Development) Programme | 400,000 | 500,000 | 500,000 | 1.4 million |
| Lifelong Learning (Number of AECs) | 25,000 | 60,000 | 85,000 | 170,000 |
Source: Department of School Education and Literacy, Ministry of Human Resource Development, Government of India, (2009). Saakshar Bharat. New Delhi, p. 32.
[1] Normally, the transition rate equation would be Transition Rate = (Enrolment in grade XII year t/Enrolment in the first cycle of higher education in year t+1)*100, without making any adjustments for repeaters in the first cycle of higher education. However, as there is no data on admissions or enrolments in the first year of higher education they are estimated, taking the total enrolment in each course of undergraduate courses, some of which are three years duration and some are four and five years. An estimate of enrolments in the first year of study has been used, and it is assumed that enrolments in higher education are equally distributed across all the years. These estimated enrolments are compared with enrolments in grade XII, the final year of higher secondary level, to arrive at an estimate of the transition rate in higher education. (Tilak and Biswal, 2015, pp. 54-55).
[2] The Eligible Transition rate is calculated as the number of students enrolled in the first year of higher education as a proportion of the number of students who graduated from the higher secondary level. (Tilak and Biswal, 2015, pp. 54-55).
[3] Average calculated from data from Government of India, Ministry of Statistics and Programme Implementation, National Sample Survey Office, (2015). Key Indicators of Social Consumption in India Education. New Delhi, p. 12.
[4] Average calculated from data from Government of India, Ministry of Statistics and Programme Implementation, National Sample Survey Office, (2015). Key Indicators of Social Consumption in India Education. New Delhi, p. 12.
[5] Note: This question was not asked of boys as it the majority of cases boys would not be asked to leave school for marriage.
[6] Others include: timings of school not suitable, language used to teach is unfamiliar, inadequate number of teachers, quality of teachers’ not satisfactory, unfriendly atmosphere. For girls specifically: non-availability of a female teacher, non-availability of a girl’s toilet.
[7] Dalit meaning “oppressed”, self-chosen political name for ‘untouchable’ castes, tribes and other disadvantaged communities in South Asia.
Written by: Katy Edwards
Written at: University of Derby
Written for: Sung Hee Lee
Date written: April 2016
Further Reading on E-International Relations
- Gender Quotas: Towards an Improved Democracy
- Safeguarding a Woman’s Right to Education and Water in Africa
- Eating Last and the Least: Analysing Gender in Global Hunger
- Drones, Aid and Education: The Three Ways to Counter Terrorism
- Gender and Violence: Feminist Theories, Deadly Economies and Damaging Discourse
- Queer Asylum Seekers as a Threat to the State: An Analysis of UK Border Controls